U.S. Billion-Dollar Weather & Climate Disasters 1980-2024

The following is sourced from NOAA at: https://www.ncei.noaa.gov/access/billions/

The U.S. has sustained 400 weather and climate disasters since 1980 in which overall damages/costs reached or exceeded $1 billion. Values in parentheses represent the 2024 Consumer Price Index cost adjusted value (if different than original value). The total cost of these 400 events exceeds $2.785 trillion.

Select the NCEI link (above) for a listing of the billion dollar events during the past 45 years.

Bipartisan Infrastructure Law and Inflation Reduction Act (BIL-IRA) Awards Explorer

From NOAA External Affairs

December 18, 2024

The below interactive Awards Explorer showcases awards made by NOAA with funding from the Bipartisan Infrastructure Law and Inflation Reduction Act

Source: https://noaa.maps.arcgis.com/apps/dashboards/4ac5590ab5c44d1882e0b9a95681bcac offsite link

For more details on how to use the Explorer see the “User Guide” tab within the Explorer.

For additional support accessing information available through this Explorer, please reach out to the NOAA contact: dashboard.bilira@noaa.gov. Award information can also be downloaded from the Explorer via the “Download” tab.

2024 Billion Dollar Events

From NOAA NCEI

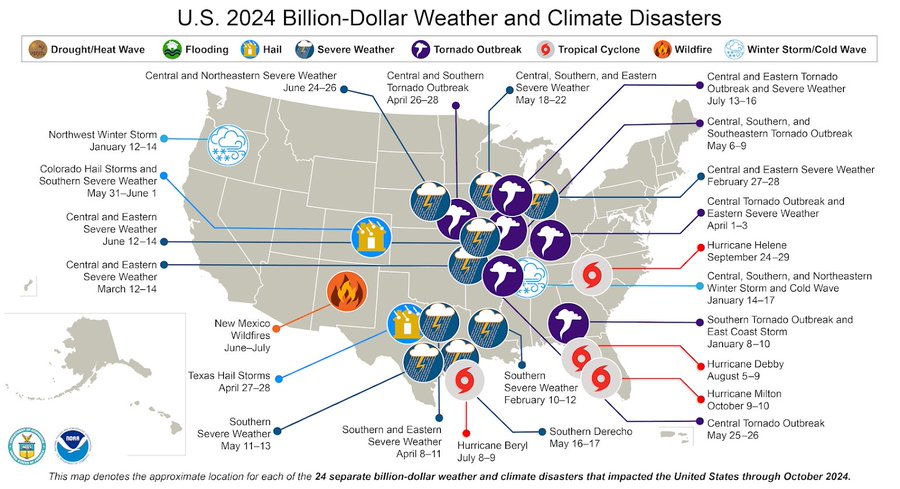
Three new hurricanes (Debby, Helene, and Milton) and one tornado outbreak were added to the 2024 Billion Dollar Disaster total. The year-to-date total now stands at 24 events—the second-highest event total by this point in the year.

https://bit.ly/ClimateReports202409

U.S. map showing locations of billion dollar disasters in 2024 through the middle of October with icons and text describing each event.

Climate change is making home insurance costs more expensive.

From CBS News (Li Cohen) — September 20, 2024

https://www.cbsnews.com/news/maps-home-insurance-costs-state-extreme-weather-risks/?ftag=CNM-00-10aab7e&linkId=595437755

Hurricane Francine in Louisiana, flooding in the Carolinas and wildfires in California are among the extreme weather events impacting millions across the U.S. just in the past week. And it’s not just about the physical risks — it’s having a major impact on the affordability of having a home, as extreme weather continues to feed into the rising costs of home insurance

In some areas, homes are such great a risk that they’re too expensive to insure — if private insurance is even available at all. 

How much does the average person spend on home insurance?

“From 2017 to 2022, homeowners insurance premiums rose 40% faster than inflation,” a June report by the Bipartisan Policy Center says. “…For millions of households already struggling to make their mortgage payments, these monthly insurance costs are a significant burden. They can also put homeownership out of reach for prospective first-time homebuyers.”

The range of homeowners’ insurance costs is widespread. In Vermont, Bankrate data shows that people pay an average of $67 a month for a $300,000 dwelling limit, while in Nebraska, the most expensive home insurance state, people pay an average of $471 per month — an annual policy that amounts to more than $3,300 above the national average. 

Other parts of insurance coverage are not included in these amounts, such as other structures, personal property and loss of use, which are typically listed as coverage B, C and D, respectively, in coverage policies. And depending on your location, you may also need separate deductibles for wind or storm damage, will likely be determined based on a percentage of your dwelling coverage.

“While inflation has slowed down since its peak in June 2022, insurance rates are reactionary,” Bankrate said in its September report. “The cost of home insurance is still increasing due to the impact inflation has had on the previous losses experienced by the insurance company, the elevated cost of building materials and the high likelihood of future extreme weather-related losses.” 

Home location matters for insurance costs 

Across the U.S., people are dealing with risk of earthquakes, tornadoes, floods, hurricanes, wildfires and severe storms across the seasons. In California, which, as of Sept. 17, is battling six active wildfires, the growing risk of such events has left some areas “essentially ‘uninsurable‘,” according to researchers at First Street Foundation, a nonprofit that studies climate risks. The group found that about 35.6 million properties — a quarter of all U.S. real estate — are facing higher insurance costs and lower coverage because of climate risks. 

That combination also devalues their properties. 

San Bernardino County, which accounts for six out of the 10 worst ZIP codes in the state for insurance non-renewals, is also among the most at-risk of natural hazards and climate change, according to FEMA. The county in Southern California is currently combatting both the Bridge and Line Fires, which combined have burned more than 93,000 acres. 

The fire risk in California — which has also been battling the historically large Park Fire for nearly two months — is now so high that both Allstate and State Farm have paused sales of property and casualty coverage to new customers in the state. 

“The cost to insure new home customers in California is far higher than the price they would pay for policies due to wildfires, higher costs for repairing homes, and higher reinsurance premiums,” Allstate told CBS News.

AAA is also opting out of renewing some policies in Florida, a state that has seen increasingly devastating impacts of flooding and hurricanes. Without private insurance offers, it’s up to insurance policies made available by the government, such as the National Flood Insurance Program, to assist. 

It’s not just an issue for coastal areas and wildfire-prone states. In fact, the most impactful weather events are those that do not get categorized with names. 

The Insurance Information Institute found in a May 2020 report that severe convective storms — thunderstorms — “are the most common and damaging natural catastrophes in the United States.” Tornadoes are often a product of those storms, and Nebraska, the most expensive home insurance state on average, was impacted by five of the top 10 costliest U.S. catastrophes involving tornadoes, according to the report.  

There have already been 20 billion-dollar disasters nationwide so far this year, as of Sept. 10, with 14 of those involving severe weather or tornadoes. 

As the risk grows, affordability dwindles 

Nearly half of U.S. homes face a severe threat of climate change, with about $22 trillion in residential properties at risk of “severe or extreme damage” from flooding, high winds, wildfires, extreme heat or poor air quality, according to a study earlier this year by Realtor.com

But Bankrate has also found that more than a quarter of homeowners say they aren’t financially prepared to handle the costs that come with it. 

And it’s not just homeowners. While last year was not the worst year for overall U.S. insured losses due to extreme weather, it was the worst year since at least 2014 for losses due to severe storms ($59.2 billion), according to data by AON. 

Renters are feeling those impacts as well. 

Between 2020 and 2023, multifamily housing development insurance rates increased by an average of 12.5% annually, according to a June report by the Bipartisan Policy Center

“One affordable housing provider, National Church Residences, saw its property insurance premiums increase by over 400% in the six years leading up to 2023, along with higher deductibles and reduced coverage,” the report says. National Church Residences provides affordable housing and independent and assisted living to seniors.  

Last fall, NDP Analytics surveyed 418 housing providers across the U.S. who operate a combined 2.7 million units, including 1.7 million affordable housing units. They found that nearly a third of them saw premium increases of 25% or more from 2022 to 2023. To handle those costs, over 93% of respondents said they’d have to increase their deductibles, decrease operating expenses and/or increase rent. More than half said they would need to limit or delay investments in housing stock and projects. 

How to lower home insurance costs

The driver behind extreme weather events — rising global temperatures largely fueled by the burning of fossil fuels — is not going away anytime soon. The continued release of greenhouse gases that trap heat within the atmosphere will continue to heat up the planet for thousands of years to come, even if overuse of those

gases stopped today, which means that there are still decades to come of worsening climate disasters putting lives and homes at risk. 

But home insurance is a game of measuring risk, and there are things you can do to better protect your home that could help lessen the blow of future weather disasters. 

According to Massachusetts insurance agency C&S Insurance, resilient home features can make an impact on premium pricing. Storm shutters, reinforced roofing and flood barriers can all help lower the risk of damage to your house, and therefore, your wallet.

NerdWallet says that elevating your home’s water heaters and electrical panels, developing wildfire-resilient landscaping and installing fortified roofing are among the things homeowners can do to reduce the impacts of flooding, fires and wind, respectively.

The Council on Foreign Relations, an independent nonpartisan organization, says that more government regulations on where and how homes can be built can also help reduce costs. The group says that stopping taxpayer dollars for buildings in high-risk areas and more investment in natural infrastructure, such as wetlands and trees, can also help reduce impacts from storm surges and heat.

7 ways the Inflation Reduction Act and NOAA are helping communities thrive in face of climate change

From NOAA

August 16, 2024

7 ways the Inflation Reduction Act and NOAA are helping communities thrive in face of climate change | National Oceanic and Atmospheric Administration

Since the passage of the historic Inflation Reduction Act (IRA) in 2022, NOAA has received an unprecedented $3.3 billion and invested billions into projects that help ensure America is better able to prevent and adapt to our rapidly changing climate and the weather and climate disasters that the nation continues to experience

Here are seven ways NOAA’s Inflation Reduction Act investments are helping people, communities and local economies communities be more resilient to the changes in our climate and environment:

1. A whopping $575 million for 19 projects under the Climate Resilience Regional Challenge grant program is helping the nation’s coastal and Great Lakes states and territories weather climate-driven hazards.

These projects are addressing climate-related threats to public infrastructure and natural habitats, such as extreme heat and drought, food and water security and mental and physical health. This was also the most popular program to date in the IRA across all agencies.

2. Nine projects under the Climate Ready Workforce funding opportunity are training and placing thousands of people in climate jobs that help coastal and Great Lakes states, tribes and territories adapt to climate change 

This $60 million program is supporting vulnerable communities on the frontlines of the climate crisis – especially those that face disproportionate climate risks and inequities due to systemic and historical socioeconomic disparities and injustices – by training an estimated 4,000 people within the public and private sectors. 

3. NOAA’s Ocean-Based Climate Resilience Accelerators program is developing new, innovative technologies to help communities prepare and respond to changing ocean conditions, habitats and coastal hazards.

This $60 million investment is focusing on starting businesses in four key areas: ocean renewable energy, coastal and ocean carbon sequestration monitoring and accounting, hazard mitigation and coastal resilience, and ecosystems services. More awards will be announced later this year.

4. NOAA and the Bureau of Indian Affairs are investing $240 million to help Pacific salmon and steelhead fish hatcheries become more productive and profitable. 

An initial $54 million has already been made available to 27 tribes in the Pacific Northwest and Alaska. The remaining funding will be made available by way of a competitive selection process later this year.

5. Thanks to $3.1 million from NOAA’s National Integrated Drought Information System program and $1.8 million from the IRA, the western U.S. is benefiting from improved drought monitoring and prediction.

This investment – which supports both NOAA and partner research on drought – is enhancing decision-makers’ capacity to protect life, property and ecosystems in the region from the impacts of drought.

6. NOAA’s Industry Proving Grounds program is gathering the actionable climate information private-sector businesses need to prosper.

Building on existing private sector engagement, this $85 million investment is helping to improve NOAA’s efforts to deliver climate data and services to the finance and reinsurance, retail and architecture and engineering industries.

7. Two virtual centers of excellence are helping community organizations study the effects of excessive heat on human health and reduce heat risks.

One center, based out of Durham, North Carolina, is helping community-serving organizations conduct local climate and health studies. The other, based out of Los Angeles, is helping communities make better decisions around heat risks using the latest climate and health research.

May tornadoes, derecho storm push weather damages past $25 billion so far this year

The following article is provided by CBS News

By Aliza Chasan

Updated on: June 10, 2024 / 4:25 PM EDT / CBS News

A deadly outbreak of tornadoes last month caused $4.7 billion in damages across the Southern, Southeastern and Central U.S., making it one of the costliest weather events of the year so far, the National Oceanic and Atmospheric Administration said on Monday.

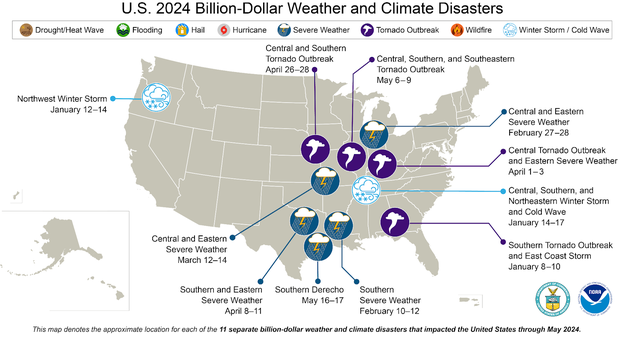
The National Oceanic and Atmospheric Administration said there had been 11 confirmed weather and climate disaster events so far this year with losses exceeding $1 billion, with the total price tag topping $25 billion. There were more than 165 tornadoes during the May 6-9 outbreak, impacting Oklahoma, Kansas, Nebraska, Michigan, Indiana, Ohio, Kentucky, Tennessee, Alabama, North Carolina, South Carolina, Georgia and Florida, officials said. 

A southern derecho —a widespread and long-lived wind storm associated with rapidly moving showers or thunderstorms— also caused more than $1 billion in damage in May, according to government data. The May 16-17 storm spanning from Texas to Florida killed at least eight people and caused $1.2 billion in damages. Winds topping 110 mph tore through parts of central and eastern Texas during the storm. The NOAA described May as a “turbulent month.”

may 2024 billion dollar disasters A map of the U.S. shows the 11 weather and climate disasters that struck this year, each costing $1 billion or more, that occurred between January and May.NOAA NCEI

The list of damaging weather events in May may grow with additional events during the NOAA update in early June, an agency spokesman said. The cutoff date for this analysis was mid-May and there were several costly hail events that occurred during the second half of May that are still being reviewed.

Other notable storms from this year include a January winter storm in the northwest and multiple tornado outbreaks in April. In March, damaging hail, tornadoes and high winds cost $5.9 billion, adjusted for inflation. Officials said a preliminary count showed 450 tornadoes across the U.S. in March and April combined. The deadliest single tornado of the year to date hit Greenfield, Iowa, on May 21, causing widespread destruction and killing five.

The 2024 Atlantic hurricane season, which is predicted to be above normal, began at the start of June and will last until Nov. 30. Federal forecasters predict 17 to 25 named storms, 8 to 13 hurricanes, and 4 to 7 major hurricanes of category 3 or higher. 

For all United States hurricanes, 2005’s Hurricane Katrina is the costliest on record, incurring $200 billion in damage. Harvey in 2017, Ian in 2022, Maria in 2017 and Sandy in 2012 cost $158.8 billion, $118.5 billion, $114.3 billion and $88.5 billion, adjusted for inflation, respectively.

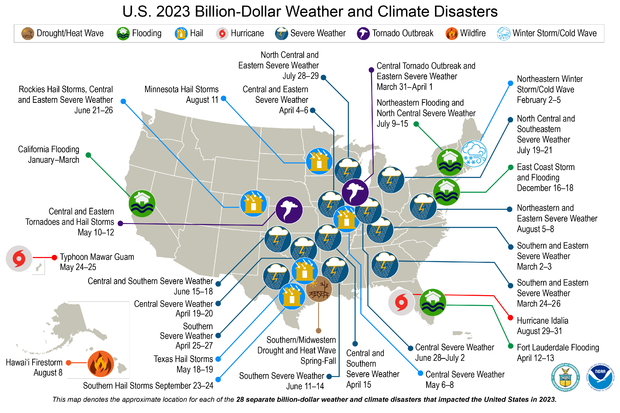
2023 billion dollar disaster map A map shows the costliest weather and climate disasters in the U.S. in 2023.NOAA

In May, officials with the Federal Emergency Management Agency joined NOAA officials to announced the hurricane outlook for the season. FEMA Administrator Deanne Criswell at the time noted that severe weather was “becoming part of our new normal,” while FEMA Deputy Administrator Erik A. Hooks. said that severe weather events “continue to increase in frequency and duration.”

“In recent years, there were just 18 days on average between billion-dollar disasters, compared to 82 days in the 1980s,” NOAA spokesperson Adam Smith said. “These shorter time intervals between disasters often mean less time and resources available to respond, recover and prepare for future events. This increased frequency of events produces cascading impacts that are particularly challenging to vulnerable socioeconomic populations.”

Last year, there were 28 weather events with losses exceeding $1 billion each —surpassing the previous record of 22 in 2020. Nearly 500 people died in those storms. Criswell warned in August of 2023 that the organization’s disaster fund could dry up and delay the federal response to natural disasters.

FEMA’s May major disaster relief fund report, which covers 2024 as of the end of April, seems to show the fund may be more than $1.3 billion in the red by August

“FEMA continues to work with the Administration and Congress to ensure sufficient funding is available,” a FEMA spokesperson said in a statement. “Without additional funding, FEMA will take steps prior to funding exhaustion to ensure resources are available to support ongoing lifesaving and life sustaining activities and provide a reserve for initial response and recovery operations for a new catastrophic event.”

In 2022, there were 18 extreme weather events that caused at least $1 billion in damage each, totaling more than $165 billion.

FY25 Appropriations

The following are links to the FY25 requested budget by NOAA (Blue Book, Congressional Justification)

https://friendsofnoaa.earth/wp-content/uploads/2024/05/NOAA_Blue_Book_FY25_Budget_Summary.pdf

https://friendsofnoaa.earth/wp-content/uploads/2024/05/NOAA_FY25_Congressional_Justification.pdf

Read the full FoNOAA letter sent to the House and Senate Appropriations Committees.

https://friendsofnoaa.earth/wp-content/uploads/2024/05/Friends-of-NOAA-FY25-Appropriations-Request.pdf

Friends of NOAA seeks $7.5B FY budget for NOAA

On May 1, 2024, Friends of NOAA released its FY25 NOAA budget request for NOAA, which exceeds the administration’s budget request. Critical infrastructure, observations and resilience programs at NOAA are in need of robust funding during a time when the country faces more billion dollar disasters on an annualized basis.

Please find the full letter here.

https://friendsofnoaa.earth/wp-content/uploads/2024/05/Friends-of-NOAA-FY25-Appropriations-Request.pdf

BAE Systems

At BAE Systems, our dedication shows in everything we do to provide our customers world-class instruments, spacecraft, tactical hardware, and discriminating capabilities for civil, commercial, aerospace and defense applications. As a proven partner with a rich legacy of innovation, our skilled people are pioneering inventions and technologies to defend our national security, protect our uniformed service members, and contribute to the prosperity and sustainability of our local communities, our planet, and beyond.

National Hurricane Center (NHC) to update products in 2024

From the National Hurricane Center on “X” (formerly Twitter); April 11,2024

The National Hurricane Center is updating products and services for the upcoming 2024 hurricane season, including the following:

1) Spanish language advisory text products
NHC will expand its offering of Spanish language text products to include all Public Advisories, the Tropical Cyclone Discussion, the Tropical Cyclone Update, and Key Messages in the Atlantic basin, and the Public Advisory, the Tropical Cyclone Discussion, the Tropical Cyclone Update, Key Messages, and the Tropical Weather Outlook in the eastern Pacific basin. These products will be issued experimentally in 2024 and will use AI techniques tested in 2023.

2) Issuance of U.S. watches and warnings on Intermediate advisories:
In order to allow for additional flexibilities for the issuance of U.S. tropical storm, hurricane, and storm surge watches and warnings, the NHC/NWS will now have the ability to issue those watches and warnings on Intermediate advisories. Previously, tropical storm, hurricane, and storm surge watches and warnings could only be issued for the United States on full or special advisory packages. Full advisory packages are issued at 5 AM, 11 AM, 5 PM, and 11 PM EDT. Beginning in 2024, NHC will be able to issue U.S. tropical cyclone watches and warnings with regular or intermediate Public advisories.

3) Extension of tropical storm (39 mph, 34 kt) and 58 mph, 50 kt)) wind radii
forecasts to days 4 and 5:

NHC is extending its tropical storm 39 mph (34 kt) and 58 mph (50 kt) wind radii forecasts to days 4 (96 hours) and 5 (120 hours) in the NHC Forecast/Advisory (TCM) in 2024. Previously, NHC has provided these forecasts out to 3 days (72 hours). Hurricane-force (64-kt) wind radii will continue to be provided out to 2 days (48 hours).

4) Weblinks in the Public Advisory:
The Tropical Cyclone Public Advisory (TCP) product will include, as needed, a reference to websites that provide pertinent graphical hazard information beginning with the 2024 hurricane season. The weblinks are intended to help reduce the length of the TCP product and to direct the focus to the most significant and impactful storm surge and rainfall hazards and areas.

5) Change to the time zone reference in the eastern Pacific:
Beginning on or about May 15, 2024, the time zone of reference for most eastern Pacific tropical cyclone forecast products will change. Most of Mexico no longer observes Daylight Saving Time, therefore Central Standard and Mountain Standard time will be used in lieu of Daylight Saving Time within those two time zones. Since Daylight Time is used within portions of Baja California and the southwestern United States, Pacific Daylight Time will continue to be used within that time zone when Daylight Saving Time is observed.


6) Experimental Cone Graphic with a depiction of inland watches and warnings for the United States:
Beginning on or around August 15, 2024, NHC will begin issuing an experimental version of the cone graphic that includes a depiction of inland tropical storm and hurricane watches and warnings in effect for the continental United States. The experimental cone graphic will be available on hurricanes.gov for both full and intermediate advisories. The current operational cone graphic will continue to be available, and there will be no changes with respect to how watches and warnings are displayed on that graphic (i.e., only coastal watches/warnings will be depicted).

7) Experimental international tropical cyclone rainfall graphics:
The Weather Prediction Center (WPC) in partnership with the NHC will issue an experimental rainfall graphic for the Caribbean and Central America during the 2024 hurricane season. This graphic provides a display of forecast rainfall totals associated with a tropical cyclone or disturbance for a specified time period, based on forecaster discretion. The graphic will allow for enhanced communication of the expected rainfall to external partners, media, and the general public. The product will be publicly available via hurricanes.gov whenever there is an active tropical cyclone or potential tropical cyclone in the region with a rainfall statement in the Public Advisory.

8) Annual update to the track forecast error cone:
The size of the tropical cyclone track forecast error cone for the Atlantic basin will be about that same through 48 h but slightly larger from 60 h through day 5 as compared to 2023. For the eastern North Pacific basin, it will also be similar in size to the 20232 cone through 60 h, and slightly larger at days 3 through 5.

9) New Marine Forecast Product “Offshore Waters Forecast for the southwestern North Atlantic Ocean”:
The current Offshore Waters Forecast for the Southwest and Tropical North Atlantic and Caribbean Sea issued by the Tropical Analysis and Forecast Branch (TAFB) of the National Hurricane Center will be divided into two new products beginning Tuesday, March 26, 2024 by 1030 AM EDT (1430 UTC). The new Offshore Waters Forecast product will consist of all the Atlantic zones currently north of 19N and be named “Offshore Waters Forecast for SW N Atlantic Ocean” (WMO ID/AWIPS ID FZNT25/MIAOFFNT5). The remaining zones in the Caribbean Sea and Atlantic waters south of 19N will comprise the newly re-configured “Offshore Waters Forecast for the Caribbean Sea and Tropical N Atlantic” (WMO ID/AWIPS ID FZNT23/MIAOFFNT3).

For more information:

NHC_Updates_2024.pdf (noaa.gov)